Dataset top
The full dataset consists of 1.1 million online retail sessions in the fashion domain, sampled from a 18-month period. All sessions in the dataset are “purchasing sessions” that resulted in at least one item purchased. The items viewed and purchased are clothing and footwear. The dataset contains content data for each of the items viewed and purchased, this is an extract of Dressipi’s fashion item data and represents descriptive labels assigned to the items such as color, neckline, sleeve length etc. The task is to predict the item that was purchased.
The dataset has:
- Sessions: The items that were viewed in a session. In this dataset a session is equal to a day, so a session is one user's activity on one day. Content: session_id, item_id, timestamp.
- Purchases: The purchase that happened at the end of the session. One purchased item is given per session. Content: session_id, item_id.
- Item features: The label data of items. Things like “color: green”, “neckline: v-neck”, etc. Content: item_id, feature_category_id, feature_value_id.
Training - Test Split top
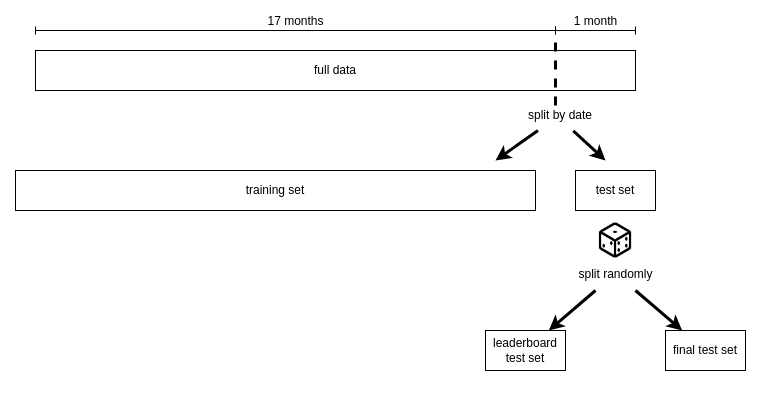
The data is split into a training and test set by date. The test set is one month, the training set is 17 months prior to the test month. The test month is then further randomly split into the “leaderboard” test set, used for the public leaderboard, and the “final” test set which will determine the final winners of the challenge. The task is to submit 100 predictions for each query session in the leaderboard and final test sets. The training set contains 1m sessions, the two test sets contain 50k sessions each.
Training Set top
The training data are sessions of users who bought something. Session length is a day. The session has all item views up to and not including the first view of the item that was bought on that day. In a separate file you get the purchased item for each session.
Test Set top
These are the query sessions to generate recommendations for. There are two test sets:
- Leaderboard Test Set: Determines the leaderboard position. Evaluated against every time you submit a prediction file.
- Final Test Set: Determines the final winners. Evaluated against once at the end.
Candidate Items top
The candidate set of items is given in a separate file and is the set of items that were purchased in the test month. The same candidate set is used for the leaderboard and final test sets.
Submitting Predictions top
Predictions Format top
The task is to submit a csv that has 100 ranked predictions for each query session.
Header and columns as in the example below. Header is required. The order of rows does not matter for the evaluation system but we recommend to sort the file by session_id and rank for easier manual inspection.
               session_id,item_id,rank

               1,100,1

               1,105,2

               1,107,3

               ...

               1,101,100

               2,108,1

               2,107,2

               ...
Evaluation Metric top
The evaluation metric will be Mean Reciprocal Rank (https://en.wikipedia.org/wiki/Mean_reciprocal_rank). The higher the purchased item was in the ranking (rank 1 is best) the better the success score.
Data Characteristics top
- Sessions are anonymous, there is a session_id but no user_id, so you won't know if two sessions are by the same person.
- The dataset only contains one purchased item per order (chosen at random). This means a session might have resulted in the purchase of a shirt and a trouser but in the dataset you can only see the shirt purchase. This is a limitation but the size of the dataset should be sufficiently large to compensate for it.
- A large chunk of test sessions have only one or two item views as input for prediction. This is partly due to the reality of a lot of sessions being very short in the underlying data and partly due to how the challenge dataset was constructed, see "Details on Data Construction" below.
-
Content data
- Content data (garment labels data) is supplied for all items in the dataset. Some candidate items might not have any data in the training sessions or purchases but they will have content data.
- Content data is representative of a “category: value” taxonomy. E.g. “color: blue” or “neckline: v-neck”. Most feature categories will only have one value for a garment, however, there are some that have multiple values. For example an item might have both “secondary_color: black” and “secondary_color: white”. In these cases an item will have two or more entries (rows) with the same category id and different value ids.
- Some items may not share any feature_category_ids if they are different types of items, for example trousers will share very few category ids with shirts and will share even less category ids with sandals.
- Items will have a different number of label assignments depending on how complicated they are. A basic black t-shirt will have less feature category ids, and thus less rows in the content data, compared to an evening dress with intricate details.
Details on Dataset Construction top
Sessions and Purchases top
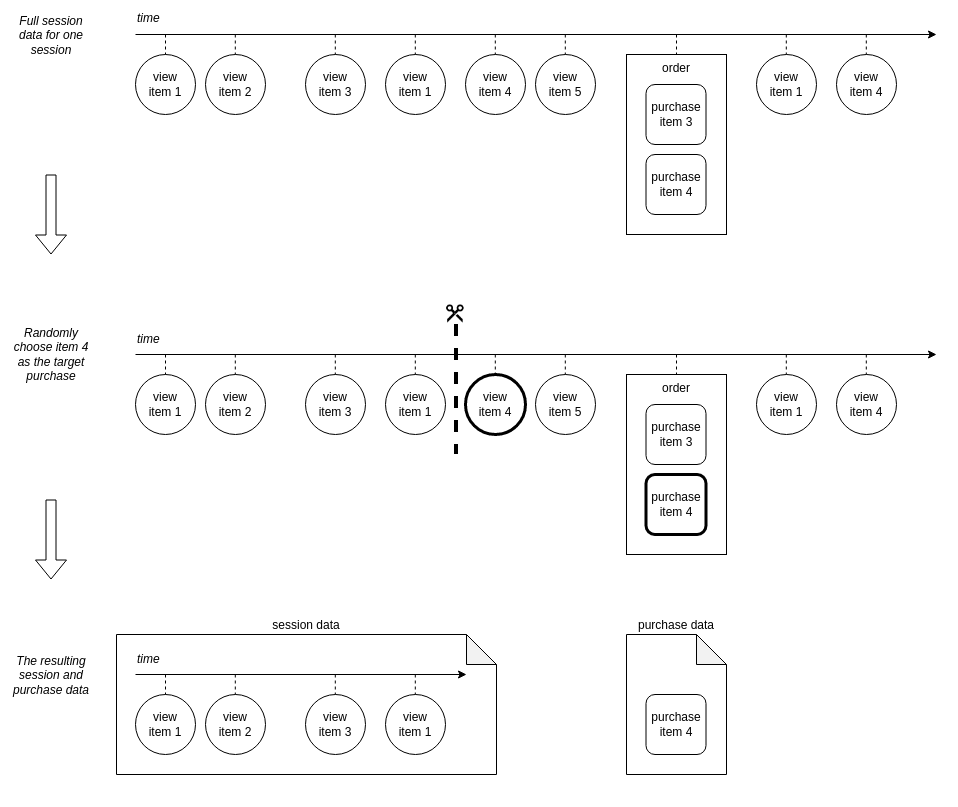
The dataset consists only of “purchasing sessions”, which are sessions that resulted in at least one item being bought. For each order placed we have chosen one purchased item at random to be the purchase of the session. The view activity of the session is then the item views up to and not including the first view of the item that was purchased. The diagram below shows how the purchasing sessions were constructed from the full session and purchasing data.
Constructing Data for Test Sessions top
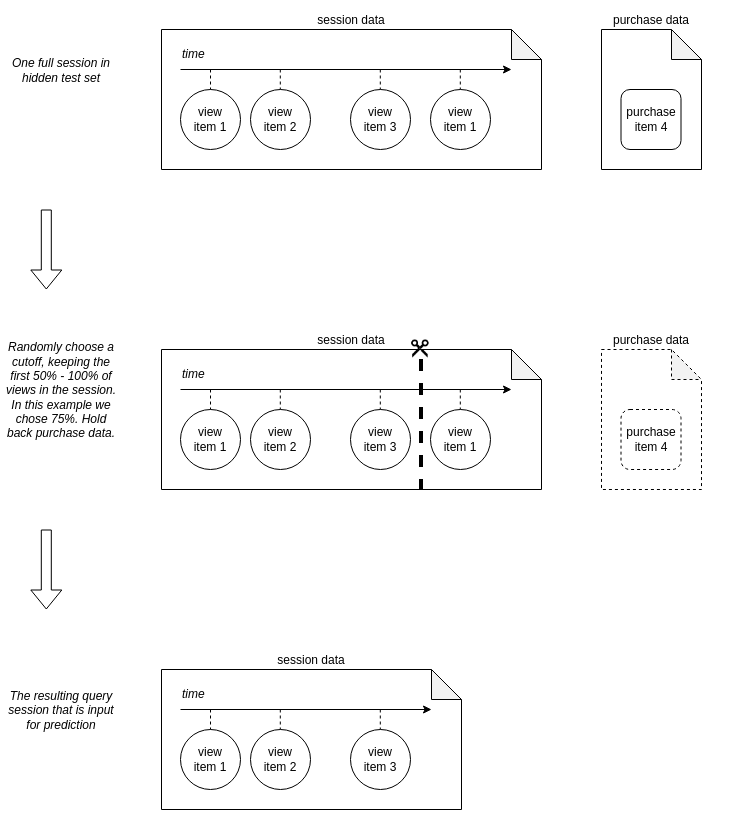
For each test session the input for prediction are the first x% of views in the session, where this is a randomly selected value between 50% and 100% for each session. The maximum length of the input data for a session would be up to and not including the first view of the item that was bought. You won’t know at which point each test sessions was cut.
The reasoning behind the random cuts is that in the real system recommendations are shown to the user at various points in their session. We want a recommender that can predict the item the user will purchase as early as possible in the session, but we have to balance that with having more information available for better accuracy of predictions as the session goes on. At some point the recommendation may no longer be useful because the user has worked through a sufficiently long journey (in the existing ranking of items presented to them) and is about to find the item they want themselves, without the intervention of the recommender. The random cuts in the test sessions are an effort to have the challenge evaluation be as close as possible to what success means in reality without making it overly complex. Please note that no cuts like this are applied to the training data and you have all item views leading up to the purchase there.
The diagram below shows how the input data for prediction is constructed from the hidden full test set.